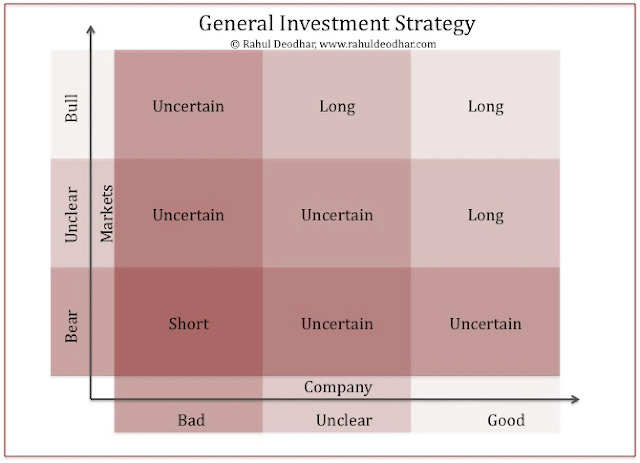
Basics: General Investment strategy
A very basic view of investment strategy is given below. I will need to explain a few terms below, but do spend time with this chart. In a nut-shell, that is all there is to investment.

Here are some basics you need to keep in mind before using that chart:
We first need to do research to understand what is a good company and a bad company. I prefer to meet the management before conclusively tipping myself into either category. Companies with hints of fraud (refer to John Hempton's treatise on Chinese companies and some other fraudsters).
Unclear company refers to company which cannot be classified as either.
It does mean that you have conclusively eliminated the possibility of apparent fraud. Yet, something about such companies do not feel right. (yes, feel!).
Alternatively, you are not convinced about the business models of such companies, though the companies may be upright and well governed.
I presume we will know about bear and bull markets. Unclear markets are typically directionless markets or range bound markets.
Uncertain investment strategy means, you cannot invest without substantial research. I must repeat SUBSTANTIAL research. It means unless you have a full scale financial model with sensitivities to various scenarios, macro and industry forecasts, appreciation of changing minor trends, met customers, suppliers, industry experts etc, you cannot take a call. It is like a minefield, you are taking a risk and analytical advantage can alleviate some of the risk.
Going Long for uncertain companies in bull market has one disclaimer that such companies must not have fraud-flags, even feeling types. Ideal strategy for that box is "uncertain".
Companies move in an out of categories. But if a company goes bad, it rarely turns good. I know people will dispute this, but that is my experience. Better stay away or go short.
Ideal chart is 3-D where another axis, industry, needs to be included. This parameters takes into account business cycles. One can logically interpolate my strategy from this chart and apply it to business cycle. If someone can make me a 3D chart please email me or leave a comment.
My book "Subverting Capitalism & Democracy" is available on Amazon and Kindle.


